Unified logging is essential when you are scaling your application, this helps in grouping the logs on component (service) level and also providing search capability on multiple services, for example: assume that you have a subscription service which have two internal SOA services, payment service and web service, if the logs are scattered and also assuming that these services are horizontally scaled you will be having hard time to debug these logs, instead if you have unified logging in place, a search on unique indentifier will get the results from all the services, this helps us in quick resolution with less effort. This article will demonstrate a POC which is built using multiple FOSS and with zero custom code to streamline unified logging. Alternatively you might be interested in having a look at Loggly, Sumo Logic and Splunk
FOSS used:
Architecture design:

Working mechanism overview:
- Telegraf running on VM instances will push logs to Kafka
- Logstash will:
- Read data from Kafka
- Modify data if required
- Presist data to ElasticSearch
- Grafana and / or Kibana will read fetch data from ES based on the queries
In this example I’m using Apache access logs as my source.
Step 1: Setup Telegraf:
Download and install Telegraf if you don’t have one running.
Below is the config which you need to add to telegraf.conf (/etc/telegraf/telegraf.conf):
Log parser input plugin config:
1 2 3 4 5 6 7 8 9 | |
Kafka output plugin config:
1 2 3 4 5 6 7 | |
If you are not using Telegraf before and just want to test this out, use this (telegraf.conf) config file.
Step 3: Setup Kafka:
Download and start Kafka if you don’t have one running
Create a Kafka topic using the command:
1
| |
Feel free to change the Kafka topic, partitions and replication according to your needs, for example: topics logs-web, logs-payments can be used with different partitions and avaliablity.
Step 4: Setup ElasticSearch:
Download and start ElasticSearch
Step 4: Setup Logstash
For now, I want to analyse the HTTP response codes hence I changed the logstash config accordingly, below is the config:
1 2 3 4 5 6 7 8 9 10 11 12 13 14 15 16 17 18 19 20 21 22 23 24 | |
Save this config to a file (logstash-test.yml) and start the logstash:
1
| |
References:
Step 5: Test the flow
Start the telegraf using the command telegraf and make random HTTP requests to the Apache server and see if the data is being presisted to ES.
Here are a few resources:
- Telegraf log location: /tmp/telegraf.log (If you used the config I used)
- Get list of ES indices - http://localhost:9200/_cat/indices?v
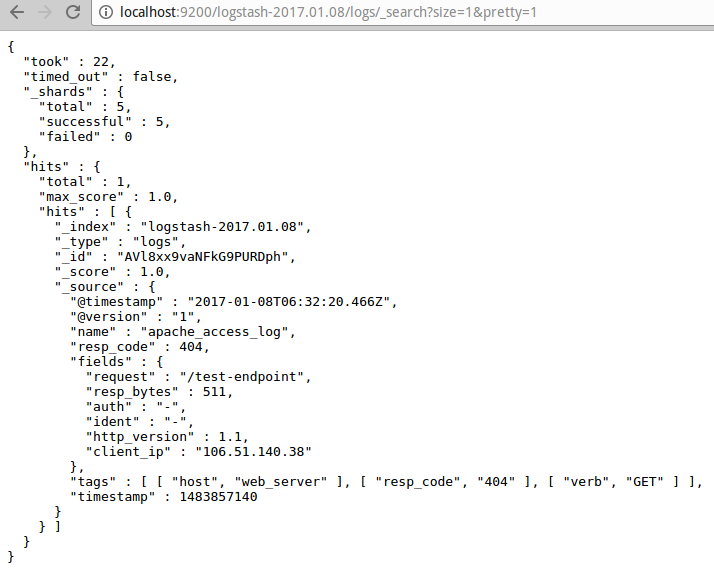
- Get data of a index - http://localhost:9200/logstash-2017.01.08/logs/_search?size=1000&pretty=1
If everything goes as expected these are a few thing which you should be seeing:
Telegraf writing to Kafka:

Data in ES:
Step 6: Setup Grafana:
- Install and start Grafana
- Add ES as data source in Grafana
- Add charts and queries
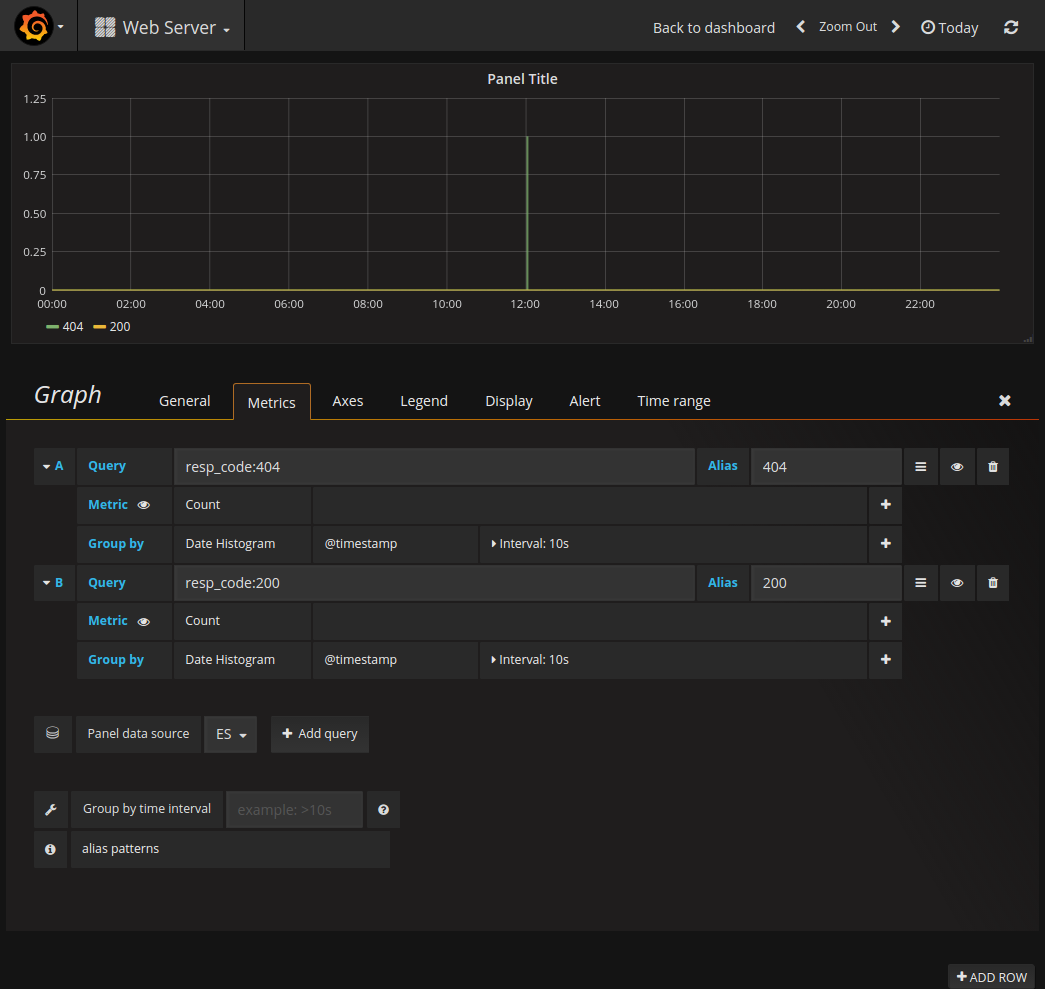
- Below is my Grafana board with monitoring of status codes 200 & 400 (Looks good if you have more data):
For Kibana, download and start Kibana, and then add ES as data source and execute queries.