Before writing code I would like to emphasize the difference between anomaly and a outlier:
- Outlier: Legitimate data point that’s far away from the mean or median in a distribution.
- Anomaly: Illegitimate data point that’s generated by a different process than whatever generated the rest of the data.
Outlier detection varies between single dataset and multiple datasets. In single dataset outlier detection we figure out the outliers within the dataset. We can do this by using two methods, Median Absolute Deviation (MAD) and Standard deviation (SD). Though MAD and SD give different results they are intended to do the same work. I’m not explaining the mathematical expressions as you can find them from wikipedia.
Let’s consider a sample dataset:
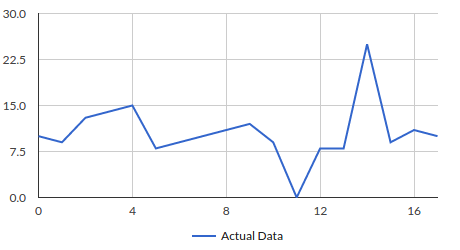
I’ve written a Python script using numpy library, this script calculates both MAD and SD:
1 2 3 4 5 6 7 8 9 10 11 12 13 14 15 16 | |
Let’s visualize the output:
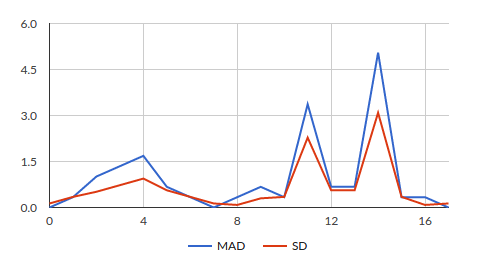
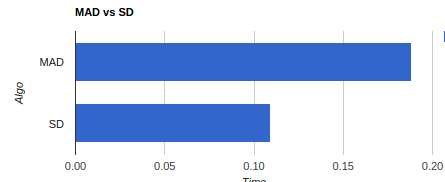
It’s clear that we’ve detected a spike if there is a change in the dataset. After comparing results of several datasets I would like to mention MAD is more sensitive when compared to SD, but more computing intensive. I’ve experimented the same code with 1 M data points, SD performed near to 2x when compared with MAD.
Multiple dataset outlier detection: In this we figure out anomaly in different datasets when compared with target dataset. For example, say you have data of your web site traffic on hourly basis for 10 days including today, and you would like to figure out if there is an outlier in today’s data when compared with other 9 days data. I’ve done this using Mahalanobis distance algorithm and implemented using Python with numpy.
Let’s consider sample dataset:
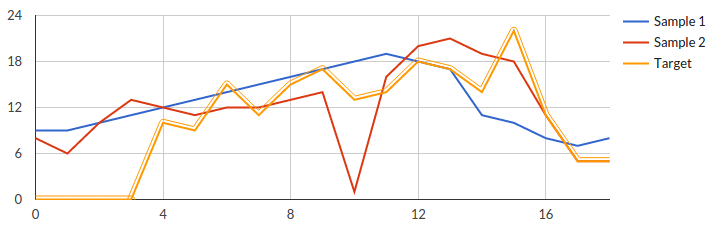
The highlighted path is the target dataset.Let’s feed this to the algorithm:
1 2 3 4 5 6 7 8 9 10 11 12 13 14 15 16 17 18 19 20 21 22 23 24 25 | |
This gives us the outliers, on visualizing the result we get:
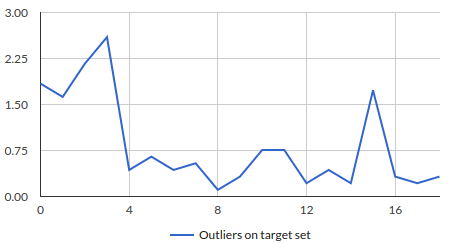
If you have a look on the data we fed into the algorithm it’s clear that we are able to detect the outliers for today’s input when compared to other x days.
Feel free to explore are a few other algorithms Cosine similarity, Sørensen–Dice coefficient, Jaccard index, SimRank and others.